Risk Categories allow you to standardize how risks are evaluated and classified across your entire project. By defining clear thresholds for probability, impact, and other metrics, you ensure that all team members assess risks consistently using the same scale and terminology.Documentation Index
Fetch the complete documentation index at: https://docs.davinci-app.com/llms.txt
Use this file to discover all available pages before exploring further.
Risk Dimensions
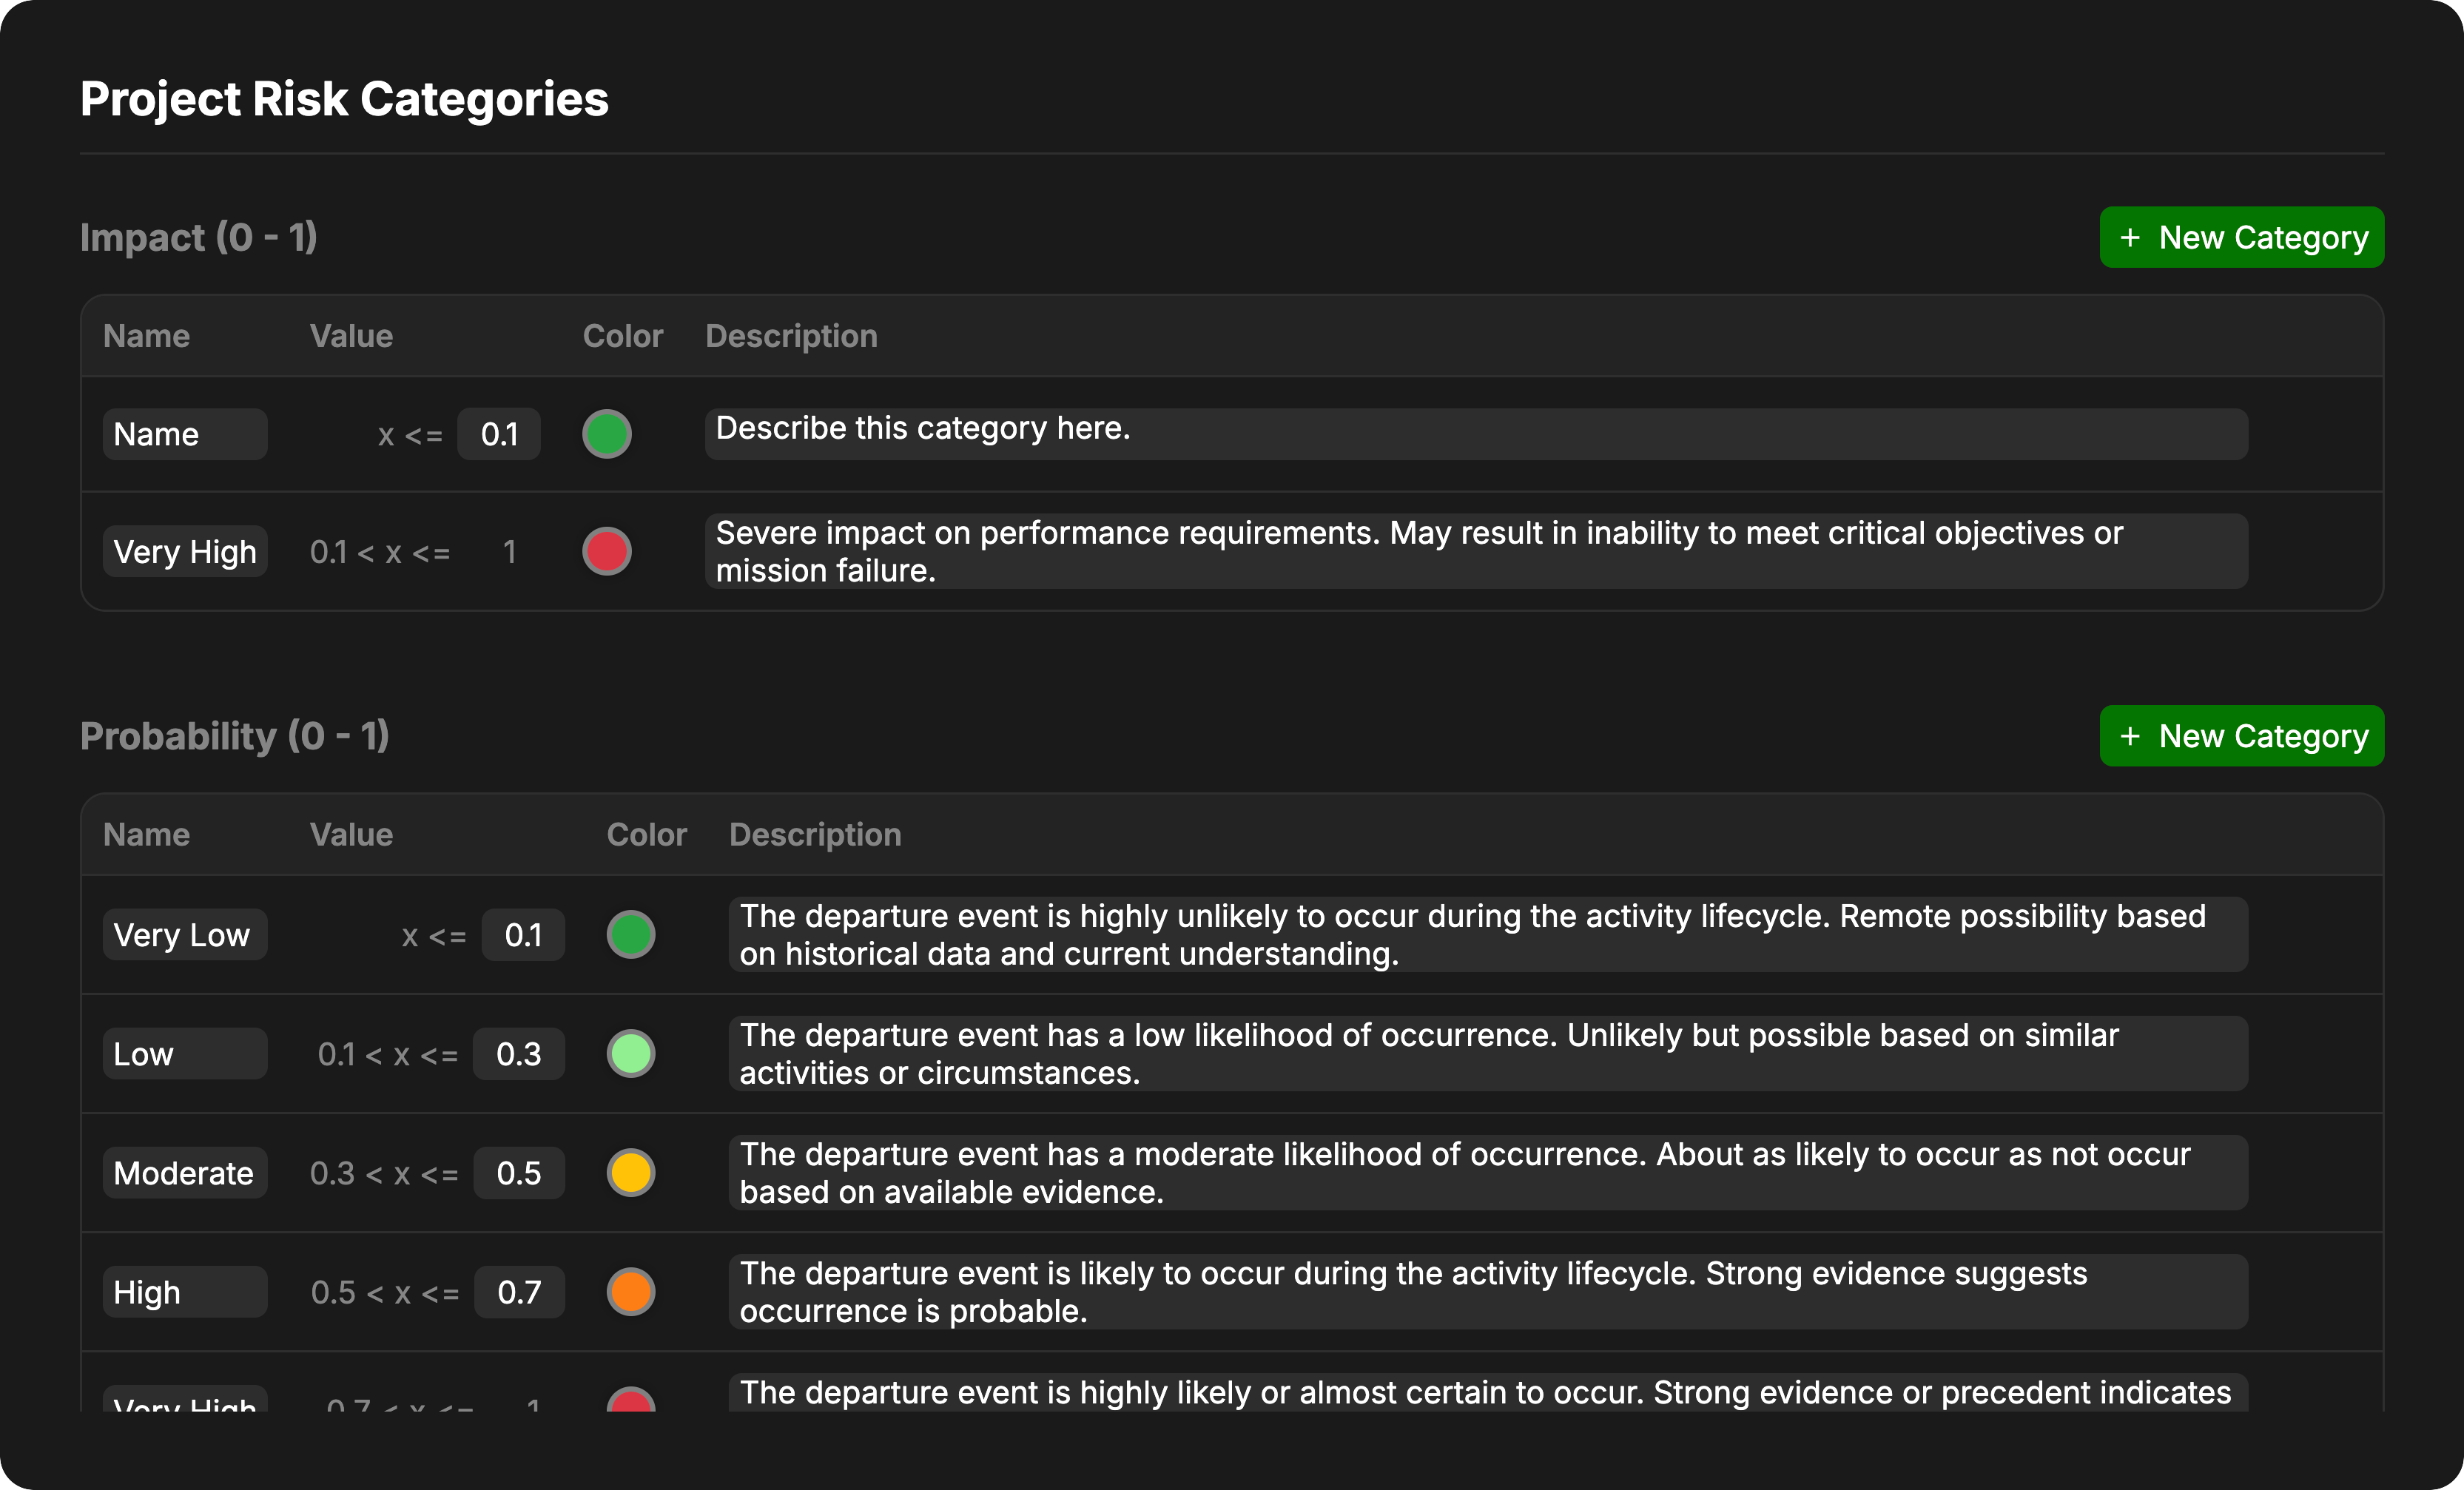
Davinci organizes risk assessment into four main dimensions, each ranging from 0 to 1. You can configure the specific categories and thresholds for each dimension to match your organization’s risk management standards.Impact
Impact measures the severity of the consequences if a risk event were to occur. This can encompass technical performance, cost, schedule, or safety consequences.- Low values (near 0): Negligible or minor effect on objectives.
- High values (near 1): Catastrophic failure or inability to meet critical objectives.
Probability
Probability represents the likelihood that the risk event will occur.- Low values (near 0): Extremely unlikely or rare.
- High values (near 1): Almost certain to occur.
Detectability
Detectability measures the ease with which a risk or failure mode can be discovered or noticed before it results in a failure. This is commonly used in Failure Mode and Effects Analysis (FMEA).- Low values: High likelihood of detection (the risk is obvious).
- High values: Low likelihood of detection (the risk is hidden or hard to catch). (Note: In some methodologies, high detectability is “good” (low risk score), while in others a high score means “hard to detect” (high risk). Configure your color scales and descriptions to match your preferred convention.)
Criticality
Criticality is used to classify the overall urgency or importance of a risk. Criticality is calculated based on the Probability score and the Impact score for a given Risk object.Configuring Categories
Each dimension is broken down into specific Categories. These categories partition the 0 to 1 continuous scale into discrete buckets (e.g., Low, Medium, High).Range Logic
All risk dimensions operate on a normalized scale from 0 to 1.- Categories are defined by their Upper Bound.
- The system automatically calculates the range for each category based on the upper bound of the category below it.
- The last category always extends to 1.
- Minor Risk: Set value to
0.1. This covers the range0 ≤ x ≤ 0.1. - Major Risk: This covers the range
0.1 < x ≤ 1.0. [This Category Value cannot be edited]
Category Properties
For each category within a dimension, you can define:- Name: The label displayed for this level of risk (e.g., “Moderate”, “Likely”).
- Value: The numerical upper bound for this category.
- Color: The color used to represent this risk level in charts, matrices, and the interface.
- Description: A detailed explanation of what constitutes this level of risk.
There must be at least one category defined for each dimension type.